Image Details
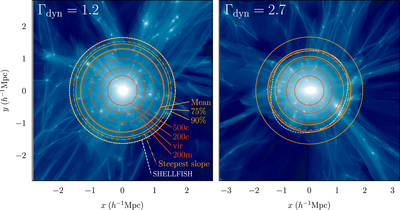
Caption: Figure 1.
Visualization of radius definitions for two representative halos with low and high accretion rates (left and right panels, respectively). Both halos have masses of about ﹩1.5\times {10}^{14}\,{h}^{-1}\,{M}_{\odot }﹩ and were selected from the L0125-WMAP7 simulation at z = 0. The logarithmic color map shows projected density through slabs of thickness ﹩0.3{R}_{200{\rm{m}}}﹩. Each line shows one of the radius definitions discussed in this paper. The red circles indicate, from the center outward, ﹩{R}_{500{\rm{c}}}﹩, ﹩{R}_{200{\rm{c}}}﹩, ﹩{R}_{\mathrm{vir}}﹩, and ﹩{R}_{200{\rm{m}}}﹩. The yellow circles show different estimates of the splashback radius, namely ﹩{R}_{\mathrm{sp},\mathrm{mn}}﹩, ﹩{R}_{\mathrm{sp},75 \% }﹩, and ﹩{R}_{\mathrm{sp},90 \% }﹩. In the left panel, all splashback radii are larger than ﹩{R}_{200{\rm{m}}}﹩ owing to the relatively low accretion rate of the halo, whereas ﹩{R}_{200{\rm{m}}}\approx {R}_{\mathrm{sp},75 \% }﹩ for the fast-accreting halo in the right panel. The dotted–dashed yellow lines show the More et al. (2015) prediction for the radius where the slope of the density profile is steepest, which corresponds to a visible drop in the projected density. The relationship of this radius to the dynamically calculated radii from SPARTA also depends on the accretion rate: in the left panel, this radius is greater than ﹩{R}_{\mathrm{sp},75 \% }﹩; in the right panel, it is smaller. The white dashed lines show slices through the three-dimensional splashback shells computed by SHELLFISH (Mansfield et al. 2017). For the slowly accreting halo on the left, the shell is almost spherical and coincides with ﹩{R}_{\mathrm{sp},90 \% }﹩. The fast-accreting halo on the right is less spherical, and the SHELLFISH shell visibly traces the density drop toward the lower left of the halo. The background visualizations were created using the gotetra code by P. Mansfield (https://github.com/phil-mansfield/gotetra), which uses a tetrahedron-based estimate of the density field (Abel et al. 2012; Kaehler et al. 2012; Hahn et al. 2013). The same halos are shown in Figure 1 of More et al. (2015), although with a thinner projection depth and a different color scheme.
Other Images in This Article
Show More
Copyright and Terms & Conditions
© 2020. The American Astronomical Society. All rights reserved.