

Image Details
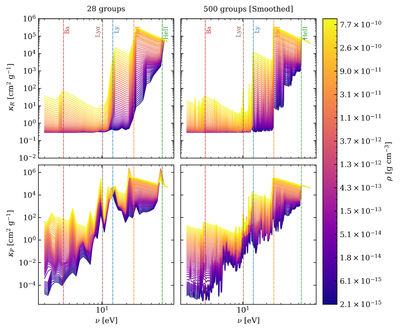
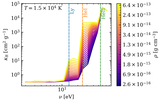
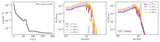
Caption: Figure A1.
Rosseland (top) and Planck (bottom) opacities as a function of photon energy for 28 (left) and 500 (right) frequency groups for T = 1.5 × 10⁴ K, and densities 2.1 × 10⁻¹⁵–7.9 × 10⁻¹⁰ g cm−3. The vertical dashed lines show the Lyα emission line (10.2 eV), in addition to the Balmer, Ly, He I, and He II edges. The 500 frequency groups case has been smoothed by applying a median filter of five grid points to suppress emission lines and only emphasize the continuum emission.
Other Images in This Article
Copyright and Terms & Conditions
© 2026. The Author(s). Published by the American Astronomical Society.

Copyright ©
2026 Astronomy Image Explorer. All Rights Reserved.
