

Image Details
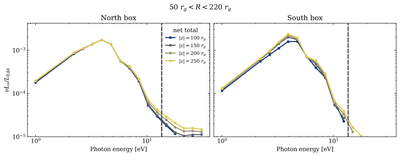
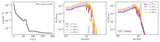
Caption: Figure 3.
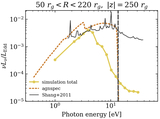
The emergent emission spectrum from the (left) north and (right) south hemispheres of the simulation. The solid lines show the total emission, while the vertical dashed line denotes 13.6 eV, where the H I Lyman edge is expected to occur. The spectra are computed for different heights (z) ranging from ±100rg to ±250rg, with the x boundary extending from 50rg to 220rg. Note that by z ≳ 200rg, the top/bottom boundaries do not intersect any photosphere within the x range we consider.
Other Images in This Article
Copyright and Terms & Conditions
© 2026. The Author(s). Published by the American Astronomical Society.

Copyright ©
2026 Astronomy Image Explorer. All Rights Reserved.
