

Image Details
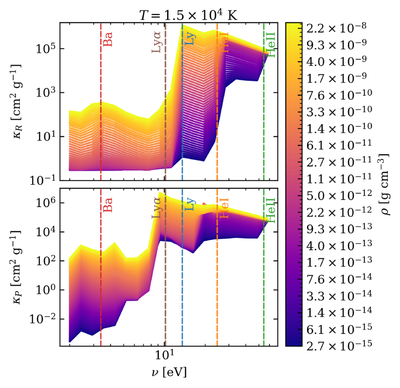
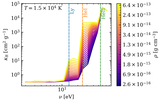
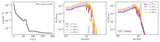
Caption: Figure 1.
Rosseland (top) and Planck (bottom) opacities as a function of photon energy in the selected frequency bins with T = 1.5 × 10⁴ K and densities ranging from 2.7 × 10⁻¹⁵ to 2.8 × 10⁻⁸ g cm−3, taken from the TOPS opacity table (J. Colgan et al. 2016) assuming solar abundance. The higher end of this range is representative of the disk densities typically predicted by α-disk models. The dashed vertical lines mark the frequencies where H I Balmer, H I Lyman, He I, and He II edges are expected to occur, as well as the Lyα emission line. For higher densities, the Ly edge is the most prominent feature in the Rosseland opacity plot. Note that the opacity table only reaches floor values for this temperature for densities below 5 × 10⁻¹⁶ g cm−3.
Other Images in This Article
Copyright and Terms & Conditions
© 2026. The Author(s). Published by the American Astronomical Society.

