

Image Details
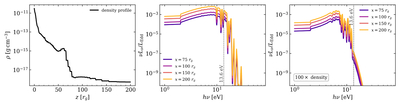
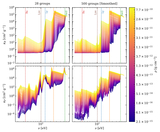
Caption: Figure A2.
(Left) The vertical (in z) density profile extracted from the full 3D simulation at x = 100rg along with the frozen evolution. (Middle) The spectrum from this simulation when radiation has reached steady state at x = 75, 100, 150, 200 rg, along with the vertical gray dashed line indicating the Ly edge at 13.6 eV. Besides some spikes that occur due to emission lines, there is no break at the Ly edge. (Right) The spectrum from an identical simulation but with the density profile scaled up by a factor of 100. Here there is a clear Ly edge at 13.6 eV.
Other Images in This Article
Copyright and Terms & Conditions
© 2026. The Author(s). Published by the American Astronomical Society.

Copyright ©
2026 Astronomy Image Explorer. All Rights Reserved.
