

Image Details
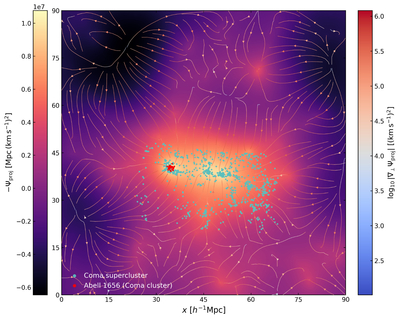
Caption: Figure 5.
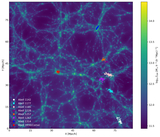
Two-dimensional projected potential and the corresponding projected acceleration field derived from the reconstructed dark matter surface-density field. The background color map shows the negative projected potential, −Ψproj, with brighter regions corresponding to deeper potential minima. The left color bar gives the value of −Ψproj. Streamlines trace the transverse projected acceleration field, g⊥,proj = −∇⊥Ψproj, and converge toward regions of high projected mass concentration. Their color encodes ﹩{\mathrm{log}}_{10}| {{\boldsymbol{g}}}_{\perp ,{\rm{proj}}}| ﹩, as indicated by the right color bar. Cyan and red points mark galaxies in the Coma supercluster and the Coma cluster, respectively.
Other Images in This Article
Copyright and Terms & Conditions
© 2026. The Author(s). Published by the American Astronomical Society.

