

Image Details
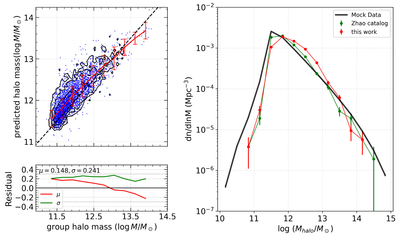
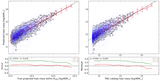
Caption: Figure 4.
Halo-scale mass comparison and halo mass functions in the SDSS reconstruction. Left panel: comparison between the reconstruction-based projected masses in this work and those listed in the Zhao group catalog. Blue points denote individual halos, while the black contours indicate the number density distribution. The red line represents the mean predicted mass in each halo mass bin from the Zhao catalog, and the vertical error bars indicate the standard deviation. The lower-left inset shows the mean (red line) and standard deviation (green line) of the residuals for each halo mass bin, with the gray dashed lines indicating ±0.3 dex. Right panel: halo mass functions derived from the reconstruction (red), the Zhao catalog (green), and the L-GALAXIES mock catalog (black) over the same redshift range. The error bars represent the statistical uncertainty in the number of halos within each halo mass bin.
Other Images in This Article
Copyright and Terms & Conditions
© 2026. The Author(s). Published by the American Astronomical Society.

