

Image Details
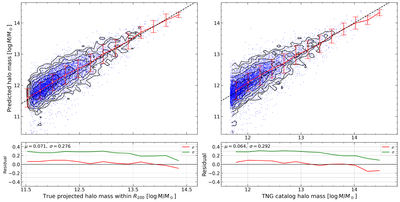
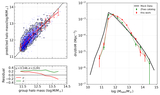
Caption: Figure B1.
Validation of the projected-aperture-based halo mass estimates after including fiber collisions and stellar-mass uncertainties in IllustrisTNG300-1. Left: comparison between the projected-aperture masses integrated within R200 in the ground-truth and reconstructed projected matter maps. Blue points denote individual dark matter halos, and black contours show their number density distribution. The red line shows the mean reconstructed projected-aperture mass in bins of the true projected-aperture mass, with error bars indicating the standard deviation. The black dashed line denotes the one-to-one relation. In the inset, the red and green lines show the mean (μ) and standard deviation (σ) of the residuals in each true projected-aperture-mass bin, respectively, while the gray dashed lines mark ±0.3 dex. Right: comparison between the reconstructed projected-aperture mass within R200 and the catalog mass M200. Visual conventions follow those used in the left panel.
Other Images in This Article
Copyright and Terms & Conditions
© 2026. The Author(s). Published by the American Astronomical Society.

