

Image Details
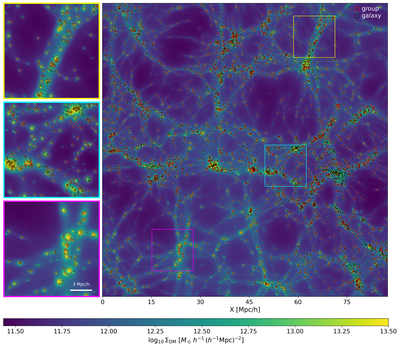
Caption: Figure 3.
Reconstructed projected dark matter density field over a ﹩90\times 90\,{({h}^{-1}{\rm{Mpc}})}^{2}﹩ region from the SDSS survey at z ∼ 0.03. The map has a pixel size of 0.097 h−1 Mpc and is obtained by averaging 100 stochastic realizations generated from different initial random seeds. The color scale encodes the logarithmic surface mass density, shown in units of ﹩{M}_{\odot }\,{h}^{-1}{({h}^{-1}\,{\rm{Mpc}})}^{-2}﹩. Black circles mark the positions of the input galaxies with M⋆ ≥ 109 M⊙, and red circles indicate galaxy groups from the SDSS group catalog (X. Yang et al. 2005, 2007; D. Zhao et al. 2025), with circle sizes proportional to their radii. Three zoom-in panels on the left provide detailed views of selected subregions, corresponding to the colored boxes on the right side. Each panel spans approximately 14 h−1 Mpc and a 3 h−1 Mpc scale bar is provided for reference.
Other Images in This Article
Copyright and Terms & Conditions
© 2026. The Author(s). Published by the American Astronomical Society.

