

Image Details
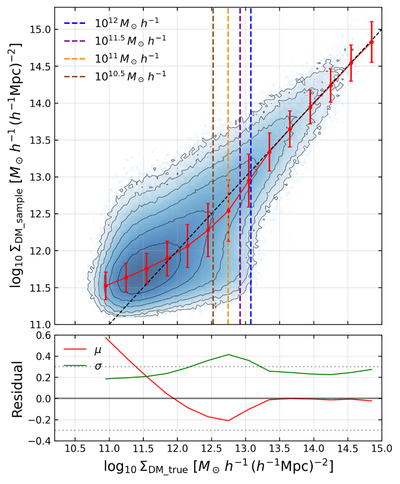
Caption: Figure 2.
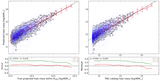
Pixel-level comparison between the true and reconstructed projected dark matter surface-density field in IllustrisTNG300-1. Black contours and the blue shading represent the logarithmic number density distribution based on 2100 × 2100 pixels, and the black dashed line marks the one-to-one relation for reference. The red line gives the mean value within each true density bin, with error bars showing the standard deviation. The four colored vertical dashed lines mark the characteristic surface densities of the least massive halos above the mass thresholds 1010.5 M⊙ h−1, 1011 M⊙ h−1, 1011.5 M⊙ h−1, and 1012 M⊙ h−1. The lower panel shows the mean (red line) and standard deviation (green line) of the residuals between the reconstructed and true values, while the gray dashed lines indicate ±0.3. All quantities are expressed in logarithmic surface-density units of ﹩{M}_{\odot }\,{h}^{-1}{({h}^{-1}\,{\rm{Mpc}})}^{-2}﹩.
Other Images in This Article
Copyright and Terms & Conditions
© 2026. The Author(s). Published by the American Astronomical Society.

