

Image Details
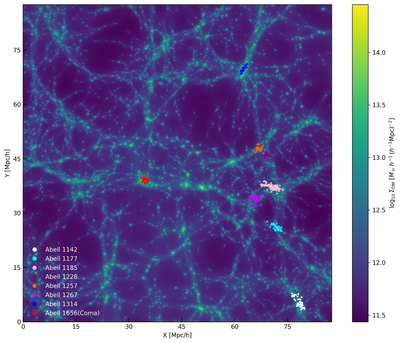
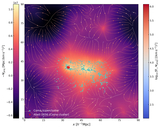
Caption: Figure A1.
Reconstructed projected dark matter density field in the SDSS region with Abell cluster members overlaid. The background color scale shows the logarithmic projected dark matter surface density. Colored dots mark galaxies identified as members of different Abell clusters, and red dots highlight the galaxies residing in Coma cluster (A1656). The clusters tend to lie at dense nodes and filament intersections in the reconstructed field, and their names are labeled in the lower-left corner.
Other Images in This Article
Copyright and Terms & Conditions
© 2026. The Author(s). Published by the American Astronomical Society.

Copyright ©
2026 Astronomy Image Explorer. All Rights Reserved.
