

Image Details
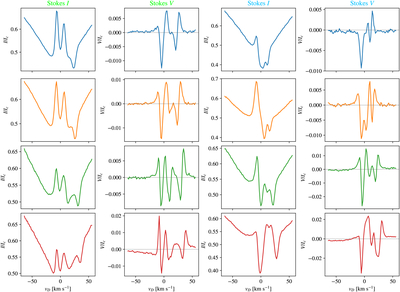
Caption: Figure A1.
Representative Stokes I and V profiles for pixels where the coronal-rain component was detected. The first two columns correspond to locations along the green path traced in panel (e) of Figure 1, and the coloring of the spectra identifies the location of each pixel along that path, matching the horizontal marks in panels (f) and (g) of Figure 1. The same system is followed in the rightmost two columns, in that case for the blue path shown in panel (e) of Figure 1. The spectra are normalized by the continuum (Ic).
Other Images in This Article
Copyright and Terms & Conditions
© 2026. The Author(s). Published by the American Astronomical Society.

Copyright ©
2026 Astronomy Image Explorer. All Rights Reserved.
