

Image Details
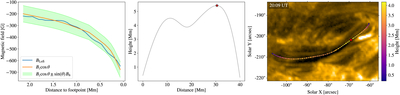
Caption: Figure 5.
Loop geometry approximation. The left panel shows the comparison between the spatial variation of BLoS over the green traced path of panel (e) of Figure 1. The green shaded area represents the maximum error commited when ignoring the projection of the horizontal magnetic field into the value of BLoS. The middle panel shows the variation of the height of the loop over the total distance along the loop. The red star marks the location of the apex. The right panel plots the projected outline of the loop over an SDO/AIA 17.1 nm passband image of the main loop structure emanating from the pore and connecting it to the nearby sunspot. The color reflects the height of the loop, and the red star marks the location of the apex.
Other Images in This Article
Copyright and Terms & Conditions
© 2026. The Author(s). Published by the American Astronomical Society.

