

Image Details
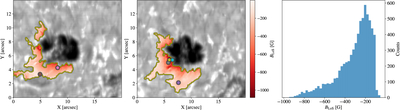
Caption: Figure 4.
WFA results. The first and second panels show the BLoS maps around the pore for the first and second raster scans of SCIP, respectively. The colored circles mark the locations of the representative profiles shown in Figure 3, with matching colors between the two figures. The contours outline the largest contiguous regions where the condensations were observed. The field corresponds to the area inside the magenta rectangles of panels (b) and (c) of Figure 1. For clarity, smaller regions are not outlined. The right panel shows the distribution of BLoS for the pixels inside these contours that show spectral signatures of coronal-rain condensations.
Other Images in This Article
Copyright and Terms & Conditions
© 2026. The Author(s). Published by the American Astronomical Society.

