

Image Details
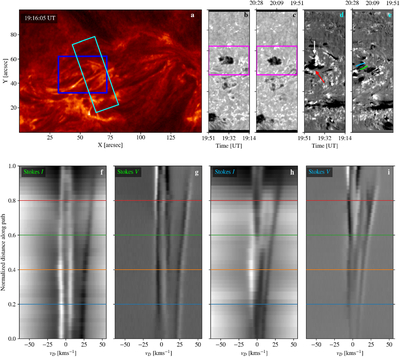
Caption: Figure 1.
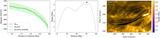
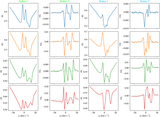
Observations. Panel (a) shows AR 13738 in the 30.4 nm passband of SDO/AIA. The cyan rectangle outlines the field of view of the SCIP observations, and the blue rectangle outlines the field of view of the top two rows of Figure 2. Panels (b) and (c) show the reconstructed field of view of the SCIP observations for the first two raster scans, at 56 km s−1 from the core of the Ca II 854.2 nm line The magenta rectangles of panels (b) and (c) outline the fields of view of the left and middle panels of Figure 4. Panels (d) and (e) show the maps of D (see Equation (1)) for the same raster scans. With this definition, dark/negative values correspond to enhanced red-wing absorption, indicating downflows, while bright/positive values correspond to enhanced blue-wing absorption. The red and white arrows in panel (d) indicate the approximate location of condensations, and are repeated on panels (a) and (b) of Figure 2. The blue and green curves outline the two traced paths whose spectrum is shown in panels (f)–(i), with matching colors between the curves and the text. They are also repeated in panel (c) of Figure 2. The colored horizontal lines in panels (f)–(i) mark the locations along the blue and green paths for which the Stokes I and V profiles are shown in Figure A1.
Other Images in This Article
Copyright and Terms & Conditions
© 2026. The Author(s). Published by the American Astronomical Society.

