

Image Details
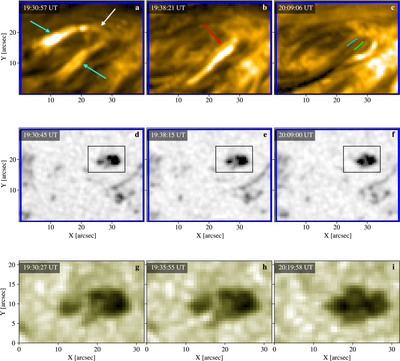
Caption: Figure 2.
Evolution of the pore coalescence event in the field of view of the blue rectangle of Figure 1. Panels (a)–(c) show the evolution on the 17.1 nm channel of SDO/AIA. The cyan arrows of panel (a) indicate the location of the strongest brightenings during the end of the coalescence (see text). The white and red arrows reflect the approximate location of the loops leading to the condensations marked with the same colors in panel (c) of Figure 1. The green and blue paths of panel (c) reflect the same paths marked in panel (e) of Figure 1. Panels (d)–(f) show the evolution on the continuum of SDO/HMI. The black squares reflect the field of view of the IRIS slit-jaw images on the 283.2 nm passband, which are shown in panels (g)–(i).
Other Images in This Article
Copyright and Terms & Conditions
© 2026. The Author(s). Published by the American Astronomical Society.

