

Image Details
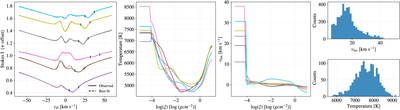
Caption: Figure 3.
Inversion results. The first panel shows representative observed spectral profiles around the core of the Ca II 854.2 nm line as functions of Doppler velocity. The continuous lines show the observations, while the dashed lines show the synthetic profiles generated with STiC. The profiles correspond to the locations marked with circles of matching colors in the first two panels of Figure 4. The black vertical markers indicate the wavelength ranges that were downweighted when obtaining the background atmosphere during the first inversion step. The profiles have been vertically offset for clarity. The second and third panels show the temperature and vLOS stratifications used to generate the synthetic profiles, as functions of the logarithm of column mass, ﹩\mathrm{log}(\xi )﹩, with matching colors. Column mass is used as a monotonic proxy for atmospheric depth, with smaller values corresponding to higher atmospheric layers. The fourth panel shows the distribution of vLOS at the top of the atmosphere for all pixels in which the Doppler shift could be determined. The fifth panel shows the corresponding temperature distribution for the pixels with successful inversions.
Other Images in This Article
Copyright and Terms & Conditions
© 2026. The Author(s). Published by the American Astronomical Society.

