

Image Details
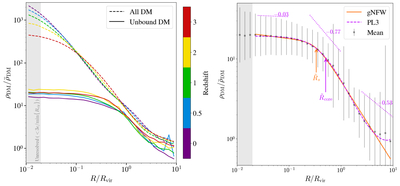
Caption: Figure 5.
Impact of halos near the filament spine on the DM density profiles. Left: comparison of length-weighted mean filament density profiles calculated using all DM particles (dashed) and unbound DM particles (solid). Here the “unbound DM” profile is constructed by removing all DM particles bound to central halos with mass above 108M⊙ together with the volumes occupied by these halos. The resulting smooth filaments exhibit flat density cores whose central densities are reduced by up to 2 dex relative to the original clumpy filaments, indicating that low-mass halos dominate the central regions within R/Rvir ∼ 0.1. Right: length-weighted mean filament density profiles stacked over all five epochs considered here, traced by unbound DM. Solid and dashed curves correspond to the best-fit gNFW (Equation (2)) and PL3 (Equation (3)) models, respectively. The logarithmic density slopes in the core (﹩\tilde{R}\equiv R/{R}_{{\rm{vir}}}\sim 0.05﹩), intermediate power-law regime (﹩\tilde{R}\sim 0.5﹩), and outskirts (﹩\tilde{R}\sim 5﹩) are labeled and indicated by dotted guide lines. The gNFW scale radius ﹩{\tilde{R}}_{s}﹩ and the PL3 core radius ﹩{\tilde{R}}_{{\rm{core}}}﹩ are marked by arrows. Densities within the unresolved region (gray shaded area) are excluded from the fitting procedure.
Other Images in This Article
Copyright and Terms & Conditions
© 2026. The Author(s). Published by the American Astronomical Society.

