

Image Details
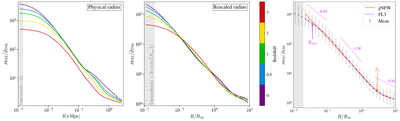
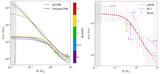
Caption: Figure 3.
Left: DM density profiles of filaments in physical radius at different redshifts. The unresolved region is shown in gray shades with the same definition as in Figure 2. Middle: the same profiles, but with radii normalized by the virial radii (Rvir) of the connecting nodes. Here, the gray area indicates a conservative global resolution limit, taken to be 3 times the DM softening length expressed in units of the virial radius of the lowest-mass node at z = 3. When normalized by the node virial radii, the mean profiles across redshifts become nearly universal down to ∼0.1Rvir. Right: best fit to the filamentary density profile in rescaled radius. The profile is derived by stacking all filament samples across redshift and computing their length-weighted mean. The error bars show the length-weighted standard deviation. Solid and dashed curves correspond to the gNFW (Equation (2)) and PL3 (Equation (3)) models, respectively. The logarithmic density slopes in the core (﹩\tilde{R}\equiv R/{R}_{{\rm{vir}}}\sim 0.05﹩), intermediate power-law regime (﹩\tilde{R}\sim 0.5﹩), and outskirts (﹩\tilde{R}\sim 5﹩) predicted by the PL3 model are shown as dotted guide lines. The gNFW scale radius ﹩{\tilde{R}}_{s}﹩ and the PL3 core radius ﹩{\tilde{R}}_{{\rm{core}}}﹩ are marked by arrows. Densities within the unresolved region (gray shade area) are excluded from the fitting procedure.
Other Images in This Article
Copyright and Terms & Conditions
© 2026. The Author(s). Published by the American Astronomical Society.

