

Image Details
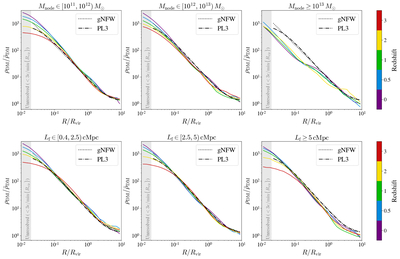
Caption: Figure 4.
DM density profiles around filaments as functions of node mass (top) and filament length (bottom). In each panel, the length-weighted mean profiles across redshifts are shown for the mass bin or length bin indicated. The best-fit gNFW (dotted) and PL3 (dashed) models for the full sample, as in Figure 3 and Table 1, are overlaid for reference. Note that no filaments are present in the Mnode > 1013M⊙ bin at z = 3. Overall, the node-mass or length dependence is weak, except in the highest-mass bin where the result is affected by small number statistics. There is a weak redshift dependence in the central density at R/Rvir ≲ 0.1, with higher-redshift filaments exhibiting lower central densities.
Other Images in This Article
Copyright and Terms & Conditions
© 2026. The Author(s). Published by the American Astronomical Society.

