

Image Details
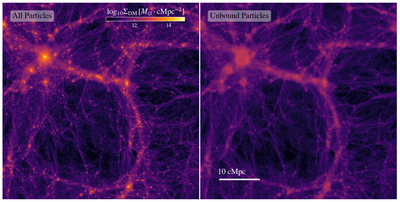
Caption: Figure B1.
Comparison between the distribution of all DM particles and unbound DM particles at z = 0 in TNG50-1. Left: the density projection of all DM particles. The full 3D box has been projected onto the x–y plane. Right: the same projection of DM particles unbound to any subfind halo.
Other Images in This Article
Copyright and Terms & Conditions
© 2026. The Author(s). Published by the American Astronomical Society.

Copyright ©
2026 Astronomy Image Explorer. All Rights Reserved.
