

Image Details
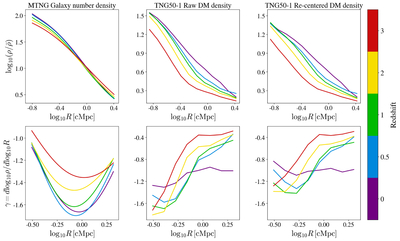
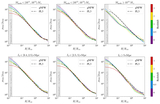
Caption: Figure 6.
Comparison of length-weighted mean filament profiles from this work with those reported by W. Wang et al. (2024), which used galaxies in the MTNG simulation to identify and characterize filaments. The upper and lower rows present the density profiles and the logarithmic density slopes, respectively. The left column shows the W. Wang et al. results. The middle column shows our results measured around the raw filament spines, i.e., without applying the shrinking cylinder recentering. The right column shows the corresponding profiles using the recentered filaments. Over the overlapping radial range R ≃ 0.16–2.5 cMpc, the MTNG galaxy-traced filaments are denser by up to ∼0.5 dex and exhibit a nonmonotonic slope profile with a characteristic scale near 1 cMpc, whereas our DM-based profiles flatten monotonically with a smaller characteristic scale of ∼0.6 cMpc, where the slope flattens toward larger radii.
Other Images in This Article
Copyright and Terms & Conditions
© 2026. The Author(s). Published by the American Astronomical Society.

