

Image Details
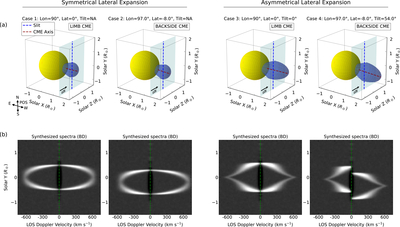
Caption: Figure 5.
Three-dimensional modeling of the CME geometry and synthesized spectra for four model configurations. The upper panels (a) show the CME geometry, with the yellow sphere representing the Sun and the blue structure representing the CME. The red dashed lines indicate the CME axis. The line-of-sight (LOS) emission-integration plane is highlighted by the shaded plane, which also shows the slit orientation marked in blue. Cases 1 and 2 assume symmetric lateral expansion, while Cases 3 and 4 include asymmetric lateral expansion. Cases 1 and 3 represent a limb CME, whereas Cases 2 and 4 represent a backside CME with the GCS-derived CME orientation. The GCS-derived orientation corresponds to a CME located 7° behind the solar limb, is referred to as the “Backside CME” configuration. The lower panels (b) show the synthesized base-difference (BD) spectral maps along the slit, as a function of LOS Doppler velocity and projected Solar Y position. The LOS Doppler velocity and intensity in the synthetic spectra are shown in arbitrary scales. The results illustrate how CME orientation, axis tilt and lateral expansion modify the spatial and spectral morphology of the emission. An animation of this figure showing the synthetic spectral evolution for all four configurations is available online.
(An animation of this figure is available in the online article.)
(An animation of this figure is available.)
The video/animation of this figure is available in the online journal.
Other Images in This Article
Copyright and Terms & Conditions
© 2026. The Author(s). Published by the American Astronomical Society.

