

Image Details
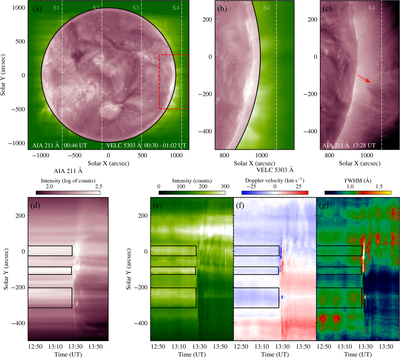
Caption: Figure 1.
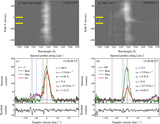
VELC and AIA observations of the CME observed on 2024 August 5 and its space-time evolution at VELC slit S4. (a) Full-disk composite image before the eruption: the VELC Fe XIV 5303 Å raster covering 1.05–1.30 R⊙ and the spatially binned AIA 211 Å image covering 0–1.05 R⊙. The four VELC slit positions are overlaid and the red dashed box marks the western-limb region. (b) Expanded view of this region. (c) AIA 211 Å image during the CME eruption, with VELC Slit S4 (Solar X ≈ 1080″) marked. (d)–(g) Space-time maps along Slit S4 from 12:42 to 14:03 UT. (d) AIA 211 Å intensity; (e) VELC Fe XIV 5303 Å peak intensity; (f) Doppler velocity; and (g) line width (FWHM), all derived from a single-Gaussian fit to the VELC spectra. Examples of the Gaussian fits are shown in Figure 2. Three black rectangular boxes highlight the prominent preeruption features in the VELC intensity space-time map (panel (e)) and are overlaid on panels (d)–(g) for easier comparison.
Other Images in This Article
Copyright and Terms & Conditions
© 2026. The Author(s). Published by the American Astronomical Society.

