

Image Details
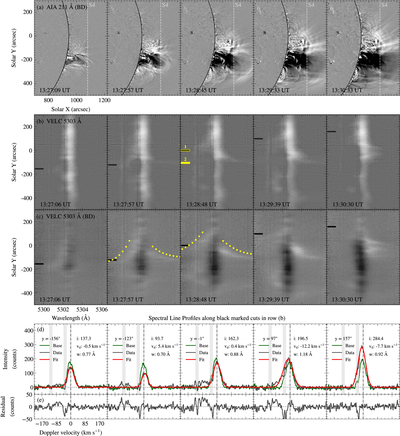
Caption: Figure 2.
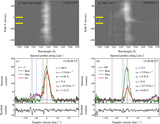
Imaging and spectroscopic evolution of the CME along VELC Slit S4 from 13:27 to 13:30 UT. (a) AIA 211 Å base-difference images showing the propagating CME front and the developing coronal dimming. (b) VELC Fe XIV 5303 Å spectral maps along Slit S4, showing the emission as a function of wavelength and solar Y. (c) Corresponding base-difference spectral maps, which more clearly highlight the CME-associated intensity depletion near the Fe XIV rest wavelength and the bifurcated red- and blueshifted structures highlighted by the yellow dotted lines. (d) Representative spectra extracted at the spatial locations marked by the black lines in panel (b), showing the observed profiles (dark gray), preevent reference profiles (green), and single-Gaussian fits to the observed profiles (red). The fitted intensity (i), Doppler velocity (vd), and FWHM (w) are also shown. The shaded wavelength regions are excluded from the fits. (e) Residuals of the single-Gaussian fits to the observed profiles. The profiles marked by the yellow line segments in panel (b) are used for the multi-Gaussian analysis in Figure 3. An animation showing the time evolution of panels (a)–(c) of this figure is available online.
(An animation of this figure is available in the online article.)
(An animation of this figure is available.)
The video/animation of this figure is available in the online journal.
Other Images in This Article
Copyright and Terms & Conditions
© 2026. The Author(s). Published by the American Astronomical Society.

