

Image Details
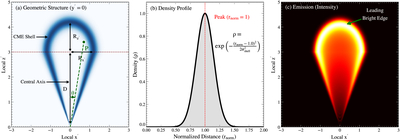
Caption: Figure A1.
Geometry and density distribution of the CME model and the corresponding synthetic emission. Panel (a) illustrates the three-dimensional cone–hemispherical cross section at ﹩{y}^{{\prime} }=0﹩, parameterized by the conical leg height (D), lateral thickness (﹩{R}_{{x}^{{\prime} }}﹩), apex cap height (﹩{R}_{{z}^{{\prime} }}﹩), and shell angle (θ) measured from the cone origin relative to the central axis for a shell point P. Panel (b) shows the density profile ρ(rnorm) of CME shell as a function of the normalized distance rnorm from the central axis, with rnorm = 1 representing position of density peak. Panel (c) shows the synthetic emission integrated along the ﹩{y}^{{\prime} }﹩ direction.
Other Images in This Article
Copyright and Terms & Conditions
© 2026. The Author(s). Published by the American Astronomical Society.

