

Image Details
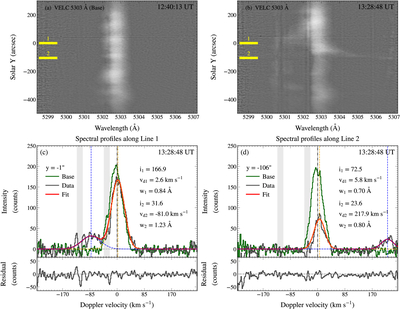
Caption: Figure 3.
Multicomponent Gaussian analysis of the VELC Fe XIV 5303 Å spectra during the CME passage. (a) and (b) show spectra along Slit S4 at the preevent reference time (12:40:13 UT) and during the CME passage (13:28:48 UT), respectively. (c) and (d) present at Solar Y = −1″ and Solar Y = −106″, respectively, at the locations marked by the yellow line segments in panels (a) and (b). The observed profiles (dark gray) are compared with the preevent reference profiles (green). The double-Gaussian fits (red) consist of a primary core component (yellow) and a Doppler-shifted secondary component (blue). The fitted intensity, Doppler velocity, and FWHM are printed for each component, with subscripts 1 and 2 denoting the primary and secondary components, respectively. The shaded wavelength regions are excluded from the fits. The lower panels show the corresponding postfit residuals.
Other Images in This Article
Copyright and Terms & Conditions
© 2026. The Author(s). Published by the American Astronomical Society.

