

Image Details
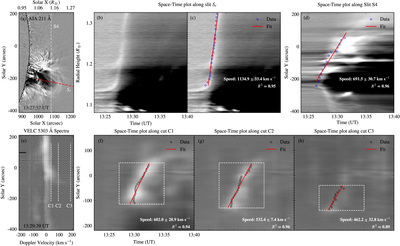
Caption: Figure 4.
Radial and lateral propagation of the CME and Doppler-resolved propagation of VELC emission features. (a) AIA 211 Å image showing the artificial slit (red dashed line, Sr) placed along the CME radial propagation direction, together with VELC Slit S4 (white dashed line). (b) AIA 211 Å base-difference space-time map along the artificial slit Sr. (c) Same as (b), with the manually tracked CME propagating front (blue diamonds) and its linear fit (red line). (d) AIA 211 Å base-difference space-time map along VELC Slit S4, showing the manually tracked lateral front (blue diamonds) and its linear fit (red line). (e) VELC Fe XIV 5303 Å spectrum at 13:29:39 UT, with three artificial cuts (C1–C3) marked at Doppler velocities of 37, 93, and 192 km s−1, respectively. (f)–(h) Space-time intensity maps constructed from the three cuts. For cuts C1 and C2, the emission is averaged over a ±14 km s−1 Doppler-shift range around their central velocities, while for cut C3 it is averaged over a ±28 km s−1 range. The positions of the emission peaks (black circles) are obtained from Gaussian fits to the intensity profiles at each height within the marked regions (white dashed rectangles), and the resulting tracks are fitted linearly (red lines) to determine the propagation speeds. The measured propagation speeds and corresponding R2 values are indicated in the respective panels.
Other Images in This Article
Copyright and Terms & Conditions
© 2026. The Author(s). Published by the American Astronomical Society.

