

Image Details
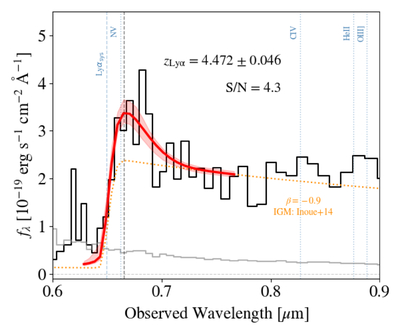
Caption: Figure 6.
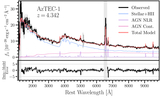
Lyα detected in the NIRSpec/PRISM spectrum from EMBER and ZENITH. The orange dashed line shows the modeled UV continuum and Lyα break, using a slope of β = −0.9 and attenuation by the IGM (A. K. Inoue et al. 2014). The dashed blue lines indicate the systemic position of Lyα and other UV emission lines at the spectroscopic redshift measured from narrow lines detected in the G395M spectrum and from ALMA. The red line shows the fitted asymmetric Gaussian profile to the observed Lyα emission line above the modeled continuum (SNR = 4.3). The resulting Lyα redshift corresponds to the wavelength at the peak of the model (vertical black dashed line); however, given that the NIRSpec/PRISM resolution is R ≈ 30 at this wavelength, this offset is unresolved and higher-resolution follow-up is required to confirm any true velocity offset.
Other Images in This Article
Show More
Copyright and Terms & Conditions
© 2026. The Author(s). Published by the American Astronomical Society.

