

Image Details
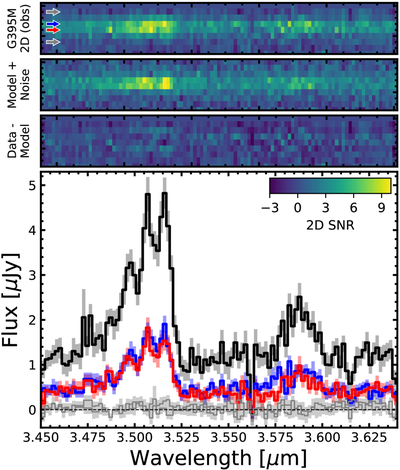
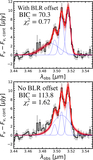
Caption: Figure 5.
EMBER G395M 2D (top panels) and 1D (bottom panel) spectra zoomed in on [N II]+Hα and [S II]. In the top panels we show the modeled 2D spectrum using msafit and its residuals. The bottom panels compare the extracted 1D spectrum (black, no slit-loss corrections) to single-row extractions (blue, red—see the corresponding arrows in 2D). We see no differences in the single-row profiles around [N II]+Hα, suggesting that both are dominated by the same point source. Grey arrows and corresponding spectra show as extractions ±2 pixels away from the trace where the PSF wings are negligible, both of which recover no signal. The modeled 2D spectrum assumes that the broad and narrow lines arise from an unresolved source which successfully reproduces the observed 2D profile.
Other Images in This Article
Show More
Copyright and Terms & Conditions
© 2026. The Author(s). Published by the American Astronomical Society.

