

Image Details
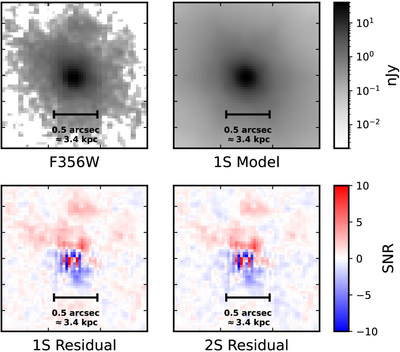
Caption: Figure 10.
Sérsic decomposition of AzTEC-1’s F356W image (top left) which overlaps [N II]+Hα. These emission lines contribute ∼10% to the total flux. We show the model from a single Sérsic fit (1S, top right) which looks identical to a double Sérsic fit (2S). Residual maps are shown in units of SNR (bottom). Both Sérsic models converge to a point source dominated profile ﹩{n}_{{\rm{S}}\acute{{\rm{e}}}{\rm{rsic}}}\gg 10﹩. There is some evidence for residual asymmetric structure in the model-subtracted maps within the inner few kiloparsecs that could be attributable to an ionized outflow; however, the aggregate flux of this residual emission does not reproduce the total flux from broad Hα.
Other Images in This Article
Show More
Copyright and Terms & Conditions
© 2026. The Author(s). Published by the American Astronomical Society.

