

Image Details
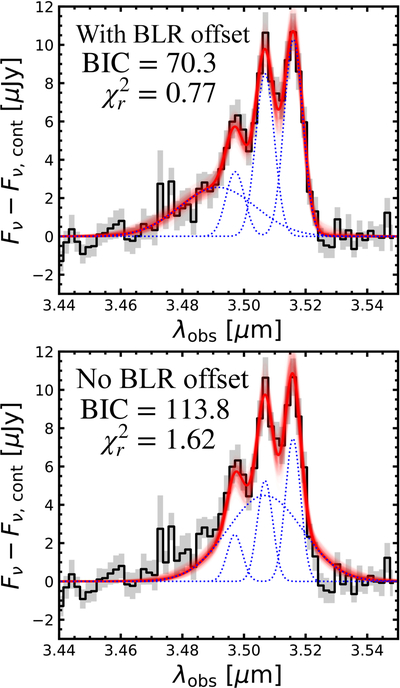
Caption: Figure 4.
NIRSpec/G395M spectrum resolving the [N II], Hα complex showing detections of both broad and narrow components. The G395M spectrum has been normalized to the total flux from the slit-loss-corrected PRISM spectrum and then continuum subtracted. Red curves represent 100 random samples from fit posteriors, while the dashed blue lines show the individual line components from the most likely model. The top panel shows a multicomponent fit where broad Hα is fixed to the systemic velocity of the narrow Hα line, whereas the bottom panel shows our fiducial model where the broad Hα line’s systemic velocity is allowed to vary independently. On each panel we report the BIC and ﹩{\chi }_{r}^{2}﹩ for the corresponding model. From these we conclude that there is significant statistical evidence to prefer a model with an offset BLR Hα component and no systemic broad emission.
Other Images in This Article
Show More
Copyright and Terms & Conditions
© 2026. The Author(s). Published by the American Astronomical Society.

