

Image Details
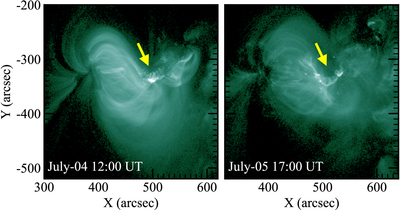
Caption: Figure 5.
AIA 94 Å images showing persistent high-temperature loop emission in the core of NOAA 11515. The left panel (2012 July 4, 12:00 UT) displays the active region approximately one day prior to the M8.8 flare. The right panel (2012 July 5, 17:00 UT) shows the postflare stage. Yellow arrows indicate active-region core loops where recurrent minor flares were observed.
Other Images in This Article
Copyright and Terms & Conditions
© 2026. The Author(s). Published by the American Astronomical Society.

Copyright ©
2026 Astronomy Image Explorer. All Rights Reserved.
