

Image Details
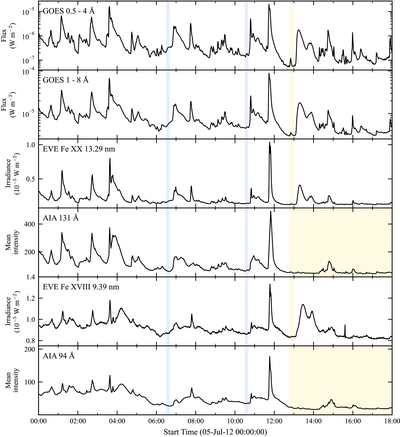
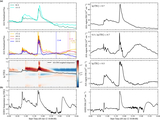
Caption: Figure A1.
Long-term light curves of GOES 0.5–4 Å, GOES 1–8 Å, EVE Fe XX 13.29 nm, AIA 131 Å, EVE Fe XVIII 9.39 nm, and AIA 94 Å, shown from top to bottom. The blue shaded intervals indicate the alternative reference intervals. The yellow shaded interval denotes 12:45–13:00 UT for the GOES and EVE measurements, while the corresponding AIA panels show the extended local-dimming intervals.
Other Images in This Article
Copyright and Terms & Conditions
© 2026. The Author(s). Published by the American Astronomical Society.

Copyright ©
2026 Astronomy Image Explorer. All Rights Reserved.
