

Image Details
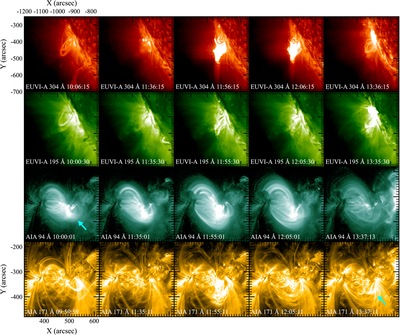
Caption: Figure 2.
Evolution of the M8.8 flare on 2012 July 5. The top and second rows show the side-on view from STEREO-A/EUVI in the 304 and 195 Å channels. The third and bottom rows present the disk-center view from SDO/AIA in the 94 and 171 Å channels. The blue arrows indicate the preflare and cooling active-region loops. An animation covering the time range 10:00–15:00 UT is available, which displays the evolution of the eruption and cooling through unannotated AIA and EUVI-A images. The animation’s duration is 13 s.
(An animation of this figure is available in the online article.)
(An animation of this figure is available.)
The video/animation of this figure is available in the online journal.
Other Images in This Article
Copyright and Terms & Conditions
© 2026. The Author(s). Published by the American Astronomical Society.

