

Image Details
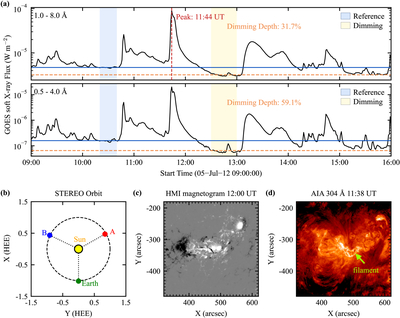
Caption: Figure 1.
Overview of the M8.8 confined flare on 2012 July 5. (a) GOES SXR flux in the 1–8 Å and 0.5–4 Å bands. The blue and yellow shaded regions denote the time intervals used to calculate the reference baseline and dimming depth, respectively. The solid blue line denotes the baseline intensity, while the horizontal red dashed line marks the dimming level. (b) Positions of SDO and STEREO-A in the ecliptic plane. (c) SDO/HMI line-of-sight magnetogram. Magnetic field strength is shown with a color scale saturated at ±1000 G. (d) SDO/AIA 304 Å image of AR 11515, with the filament that erupted in the M8.8 flare indicated by a green arrow.
Other Images in This Article
Copyright and Terms & Conditions
© 2026. The Author(s). Published by the American Astronomical Society.

