

Image Details
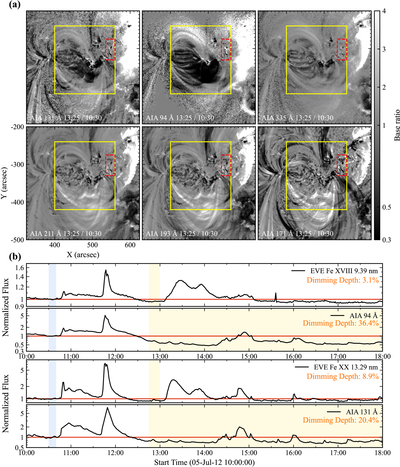
Caption: Figure 3.
Identification of the dimming source region and comparison between AIA and EVE light curves. (a) AIA base-ratio images at 13:25 UT, using 10:30 UT as the reference. The yellow box indicates the region used for extracting the localized AIA light curves. The red dashed box marks a neighboring area excluded from the integration to avoid contamination from an unrelated CME eruption. (b) Comparison of normalized light curves between EVE spectral lines and AIA source-region counts. The light yellow shaded regions denote the time intervals used for calculating the dimming depth. The upper panel compares the EVE Fe XVIII (9.39 nm) line with the AIA 94 Å channel, while the lower panel compares the EVE Fe XX (13.29 nm) line with the AIA 131 Å channel. An animation showing the evolution of the AIA base-ratio images relative to 10:30 UT is available. The animation covers 10:30–18:00 UT and has a duration of about 19 s.
(An animation of this figure is available in the online article.)
(An animation of this figure is available.)
The video/animation of this figure is available in the online journal.
Other Images in This Article
Copyright and Terms & Conditions
© 2026. The Author(s). Published by the American Astronomical Society.

