

Image Details
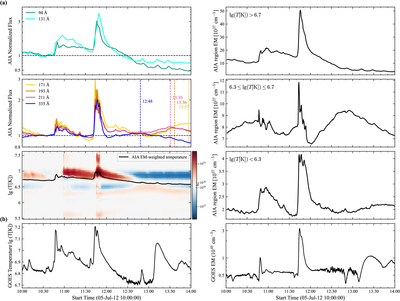
Caption: Figure 4.
Thermal evolution and plasma cooling during the confined flare. All AIA quantities are derived from the same region as in Figure 3. In panel (a), the left column shows the normalized AIA light curves in the hot channels (94 and 131 Å) and cooler channels (171, 193, 211, and 335 Å), followed by the evolution of the base-difference EM distribution. Red and blue indicate increases and decreases in EM, respectively, relative to the preflare mean during 10:30–10:40 UT. The right column shows the regional AIA EM integrated over the high-, intermediate-, and low-temperature ranges. Panel (b) presents the temperature and EM derived from the GOES soft X-ray fluxes.
Other Images in This Article
Copyright and Terms & Conditions
© 2026. The Author(s). Published by the American Astronomical Society.

