

Image Details
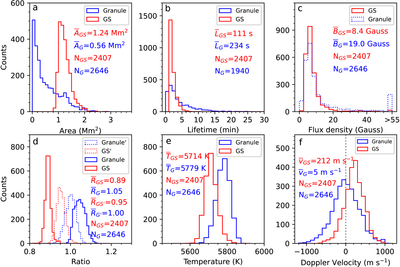
Caption: Figure 6.
Histograms of six physical parameters for the GSs and the granules. (a)–(c) Area, lifetime, and magnetic flux density histograms for GSs (red) and granules (blue). The sample numbers of GS (NGS) and granule (NG) are 2407 and 2646, respectively. For the GS sample, 677, 1625, and 105 GSs come from D1–D3, respectively. The granule sample comes from three regions (W1–W3) with the same size of about 54″ × 54″ (see Figures 2(b)–(d)). The granule numbers from W1–W3 are 867, 854, and 925, respectively. The lifetime of 1940 out of 2646 granules is determined (panel (b)), as granules with a lifetime less than 30 s (i.e., granules are detected in only one image) are excluded. (d) Histograms of the ratio of GS and granule brightness to background brightness. Two solid histograms are obtained from the NVST TiO images, while two dashed histograms are from the HMI continuum images. (e) and (f) Temperature and Doppler velocity histograms of the GSs and the granules. In panel (f), the gray dashed line indicates the Doppler velocity of 0 m s−1. ﹩{\bar{A}}_{GS}﹩ (﹩{\bar{A}}_{G}﹩), ﹩{\bar{L}}_{GS}﹩ (﹩{\bar{L}}_{G}﹩), ﹩{\bar{B}}_{GS}﹩ (﹩{\bar{B}}_{G}﹩), ﹩{\bar{R}}_{GS}﹩ (﹩{\bar{R}}_{G}﹩), ﹩{\bar{R}}_{GS^{\prime} }﹩ (﹩{\bar{R}}_{G^{\prime} }﹩), ﹩{\bar{T}}_{GS}﹩ (﹩{\bar{T}}_{G}﹩), and ﹩{\bar{v}}_{GS}﹩ (﹩{\bar{v}}_{G}﹩) represent the average area, lifetime, flux density, ratio from TiO images, ratio from continuum images, temperature, and Doppler velocity for GSs (granules), respectively.
Other Images in This Article
Copyright and Terms & Conditions
© 2026. The Author(s). Published by the American Astronomical Society.

