

Image Details
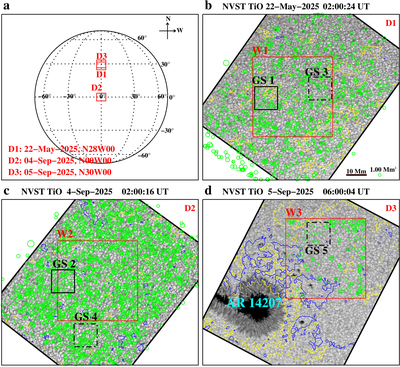
Caption: Figure 2.
Distribution of the GSs in the solar photosphere. (a) Locations of three datasets D1–D3 in the solar disk. The dates and coordinates are listed in this panel. (b) Distribution of 677 GSs in the NVST TiO image (from D1) taken at 02:00:24 UT on 2025 May 22. Each green circle represents one GS, and the size indicates the area. The FOV exhibits small and irregular displacements, leading to some GSs being located outside the TiO image at 02:00:24 UT. (c) Similar to panel (b), but for 1625 GSs from D2. Two black solid line windows in panels (b) and (c) outline the FOVs of GSs 1 and 2, respectively. (d) A TiO image from AR 14207 taken at 06:00:04 UT on 2025 September 5. In panels (b)–(d), yellow and blue curves represent the contours (±30 Gauss) of the corresponding positive and negative magnetic fields, and three black dotted–dashed line windows outline the FOVs of GSs 3–5, respectively. To ensure the reliability of quantitative measurement of relevant parameters, we select a ∼54″ × ∼54″ region outlined with red window separately (W1–W3 in panels (b)–(d)) in the three FOVs.
Other Images in This Article
Copyright and Terms & Conditions
© 2026. The Author(s). Published by the American Astronomical Society.

