

Image Details
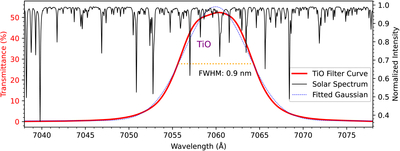
Caption: Figure 1.
TiO filter curve tested by Andover Corporation and solar spectrum from the HelioSpectrotron 5000 (https://github.com/AlexPietrow/HelioSpectrotron5000) (A. G. M. Pietrow 2026). Blue dashed line is the Gaussian fit of the filter curve, and yellow dashed line indicates the full width at half-maximum of 0.9 nm.
Other Images in This Article
Copyright and Terms & Conditions
© 2026. The Author(s). Published by the American Astronomical Society.

Copyright ©
2026 Astronomy Image Explorer. All Rights Reserved.
