

Image Details
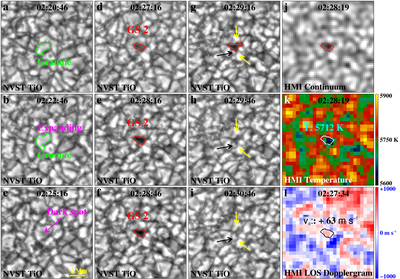
Caption: Figure 4.
Temporal evolution of GS 2 in Figure 2(c). (a) and (b) Expansion process of an exploding granule indicated with green contours. (c) A dark spot at the center of the granule. (d)–(g) The appearance (d) and evolution (e)–(g) of GS 2. Similar to Figure 3, two yellow arrows in panels (g)–(i) indicate the two surrounding granules which extrude into GS 2, and 1 black arrow, a newly emerging granule close to GS 2. (j)–(l) Corresponding photospheric continuum image, temperature map, and Dopplergram from the HMI. The temperature map is obtained by fitting a Planck function to the HMI continuum intensity in panel (j). An animation showing GS 2 evolution from 2025 September 4 02:20:46 to 02:30:46 UT is available. The real-time duration of this animation is 2 s.
(An animation of this figure is available in the online article.)
(An animation of this figure is available.)
The video/animation of this figure is available in the online journal.
Other Images in This Article
Copyright and Terms & Conditions
© 2026. The Author(s). Published by the American Astronomical Society.

