

Image Details
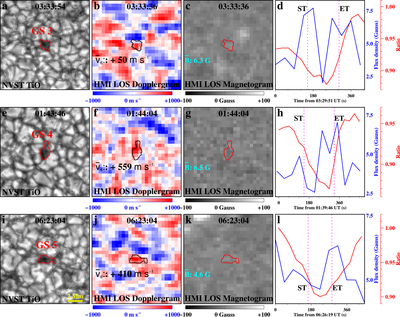
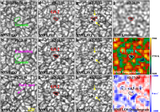
Caption: Figure 5.
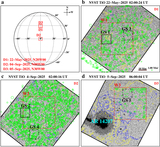
Relationship among GSs, the corresponding LOS Doppler shifts and magnetic fields. (a)–(c) GS 3 in a TiO image, corresponding LOS Dopplergram and magnetogram from the HMI. GS 3 is outlined with red (panels (a) and (c)) and black (panel (b)) contours. (d) The plot of the ratio of GS 3 brightness to the background brightness over time (red curve) and the corresponding magnetic flux density plot (blue curve). ST and ET indicate the start time and end time for GS 3, respectively. (e)–(h) and (i)–(l) Similar to GS 3, but for GS 4 in Figure 2(c) and GS 5 in Figure 2(d), respectively.
Other Images in This Article
Copyright and Terms & Conditions
© 2026. The Author(s). Published by the American Astronomical Society.

Copyright ©
2026 Astronomy Image Explorer. All Rights Reserved.
