

Image Details
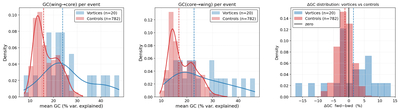
Caption: Figure 5.
Statistical comparison of GC between vortex regions and control regions for lag = 4.5 min. Left and middle panel: distributions of the peak mean GC per event for the two analyzed directions, wing→core (left) and core→wing (middle). Blue corresponds to vortices with lifetimes larger than 28 minutes (n = 20) and red to control regions (n = 782); dashed vertical lines indicate the respective sample means. Right panel: distribution of the directional asymmetry ﹩{\rm{\Delta }}{\rm{GC}}={\rm{GC}}({\rm{wing}}\to {\rm{core}})-{\rm{GC}}\,\,({\rm{core}}\to {\rm{wing}})﹩. ﹩{\rm{GC}}\,\,({\rm{wing}}\to {\rm{core}})﹩ quantifies the fraction of variance in the Mg I b2 core signal explained by past values of Mg I b2 wing signal, after accounting for the Mg I b2 signal’s own history, while ﹩{\rm{GC}}\,\,({\rm{core}}\to {\rm{wing}})﹩ represents the reverse coupling. Thus ΔGC measures the directional dominance of the interaction: positive values indicate comparatively stronger photosphere-to-chromosphere influence, whereas negative values indicate comparatively stronger chromosphere-to-photosphere influence.
Other Images in This Article
Copyright and Terms & Conditions
© 2026. The Author(s). Published by the American Astronomical Society.

