

Image Details
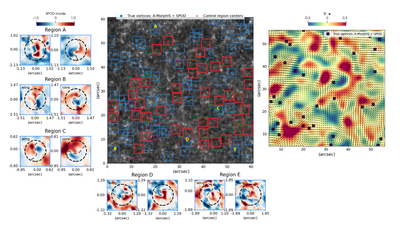
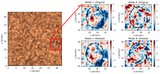
Caption: Figure 2.
Overview of the detected vortical regions. The central panel shows the field of view with vortices identified via A-MorphIS (blue rectangles) and via A-MorphIS+SPOD (blue dots) and control regions (red squares) against Mg I b2 5173 Å taken at 08:01:36 UT, 2024 July 11. Control regions were selected as areas without vortical signatures in either A-MorphIS or SPOD analysis. For selected regions, close-up views of SPOD modes presenting helical signatures in the Mg I b2 wing and core are shown in the surrounding panels with coordinates centered on the vortex in the magnesium core. The dashed circle in the SPOD panels indicates the vortex region, while the dashed line in the middle highlights the “yin-yang”-like pattern of the helical modes. The right panel shows the time-averaged horizontal velocity field over the analyzed interval (black arrows), overlaid on the divergence of the averaged velocity field. The purple crosses mark the positions of A-MorphIS+SPOD.
Other Images in This Article
Copyright and Terms & Conditions
© 2026. The Author(s). Published by the American Astronomical Society.

