

Image Details
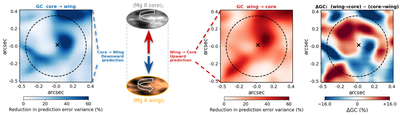
Caption: Figure 4.
Pixel-wise interaction analysis between two atmospheric layers inferred from GC in a region centered on vortex C. GC quantifies how much the prediction of a signal improves (in percent) when past values of another signal are included in the prediction model. The dashed circle marks the region in which vortex C persists and the cross indicates the center of the region. For each pixel in the target layer, the source signal is taken as the spatially averaged time series over a 4 × 4 pixel neighborhood centered on that pixel (0﹩\mathop{.}\limits^{\unicode{x02033}}﹩15 × 0﹩\mathop{.}\limits^{\unicode{x02033}}﹩15). (a) Map of ﹩{\rm{GC}}\,\,({\rm{core}}\to {\rm{wing}})﹩, measuring how much the past Mg I b2 core signal improves the prediction of the future Mg I b2 wing signal at the same pixel. (b) Schematic illustration of the two atmospheric layers sampled by the Mg I b2 (core and wing intensities averaged over the lifetime of the vortex). The circular mask marks the analyzed vortex region as indicated by the circular arrow and corresponds to the dashed circle shown in the neighboring panels. The red and blue arrows illustrate the two analyzed prediction directions: upward (past photosphere predicting future chromosphere) and downward (past chromosphere predicting future photosphere), respectively. (c) Map of ﹩{\rm{GC}}\,\,({\rm{wing}}\to {\rm{core}})﹩, showing how much the past Mg I b2 wing signal improves the prediction of the future Mg I b2 core signal at the same pixel. Panels (a) and (c) are calculated from the same temporal interval and using the same lag. Large values in both panels indicate bidirectional predictive coupling and are not mutually exclusive. (d) Map of directional asymmetry ΔGC, highlighting the dominant direction of interaction in each pixel.
Other Images in This Article
Copyright and Terms & Conditions
© 2026. The Author(s). Published by the American Astronomical Society.

