

Image Details
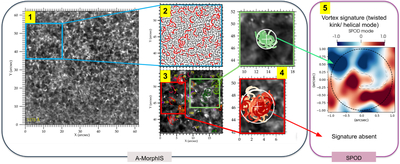
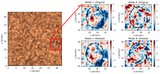
Caption: Figure 1.
Identification of vortical structures. (1) Mg I b2 line-core intensity snapshot at 07:57:24 UT on 2024 July 11. The blue box marks the subfield used in subsequent panels. (2) Output of the A-MorphIS morphological tracing algorithm applied to the blue region in panel (1). Highly curved segments (red) characteristic of swirl arms are retained. This first-level clustering operates independently on each frame, yielding per-frame swirl candidates. (3) Candidate vortex regions from spatial clustering of the curvature centers of the selected segments in panel (2). (4) Final vortices after second-level clustering over the full time series, which rejects candidates not persisting for a sufficient number of consecutive frames. Overplotted segments show the 2D-projected swirl arms integrated over the full lifetime of two accepted vortices (regions delimited in green and red). (5) SPOD is applied to each vortex candidate region in the whole domain where each mode represents a coherent spatial pattern of Mg I b2 line-core intensity fluctuations ranked by their contribution to the signal. This step looks for “yin-yang” patterns in the first 10 SPOD modes, which are consistent with a helical or “twisted” kink-like wave mode (see Figure 25 of J. M. L. Dahl 2021), that are excited by vortices. The upper panel shows an SPOD mode for the green region in step (4) that displays the helical signature (highlighted by the white dashed line). Such a signature indicates a propagating rotating disturbance in which one spatial region brightens while the opposite dims. The dashed circle marks the analyzed region containing the candidate vortex in panel (4). Positive values (red) correspond to regions with positive fluctuation amplitudes relative to the temporal mean, while negative values (blue) indicate regions with negative fluctuation amplitudes. The color scale is normalized and saturated and is therefore dimensionless. No spatial SPOD mode of the vortex candidate in the red rectangle has that signature.
Other Images in This Article
Copyright and Terms & Conditions
© 2026. The Author(s). Published by the American Astronomical Society.

