

Image Details
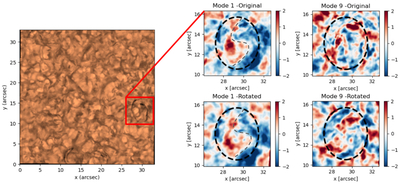
Caption: Figure A1.
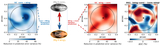
First column: synthetic Hβ core at t = 4280seconds with clockwise rotation of 10° h−1. The red square marks the subregion used to assess the impact of rotation on SPOD vortex detection. Second column: SPOD modes, which present the vortex signature, the “yin-yang” pattern as indicated by the thinner dashed line. The top row is the result of SPOD in the original data and the bottom row is the same for rotated data. Third column: same layout as the second column, but showing a less energetic SPOD mode, mode 9.
Other Images in This Article
Copyright and Terms & Conditions
© 2026. The Author(s). Published by the American Astronomical Society.

Copyright ©
2026 Astronomy Image Explorer. All Rights Reserved.
