

Image Details
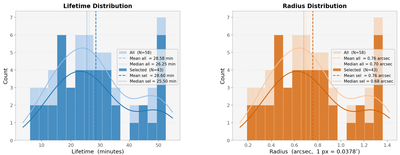
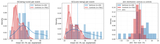
Caption: Figure 3.
Comparison of the lifetime (left) and radius (right) distributions obtained for the complete vortex sample (N = 58) detected by A-MorphIS and the selected subset used in the subsequent analysis (N = 43) detected by A-MorphIS+SPOD. Histograms show the measured distributions, while the solid curves represent the corresponding kernel density estimates (KDEs). Dashed and dotted vertical lines indicate the mean and median values, respectively.
Other Images in This Article
Copyright and Terms & Conditions
© 2026. The Author(s). Published by the American Astronomical Society.

Copyright ©
2026 Astronomy Image Explorer. All Rights Reserved.
