

Image Details
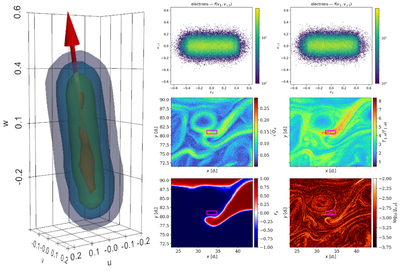
Caption: Figure C1.
Example of a localized subregion in the LS layer during the nonlinear stage. Left: 3D visualization of the electron velocity distribution function (VDF) in the selected box, shown in (v∥, v⊥,1, v⊥,2) space. The VDF exhibits a clear elongation along the magnetic field direction and a double-core structure. Top row: 2D projections of the VDF in the (v∥, v⊥,1) and (v∥, v⊥,2) planes. Middle row: spatial maps of electron agyrotropy (﹩\sqrt{{Q}_{e}}﹩) and parallel electron heating (T∥,e/T∥,e0). Bottom row: electron mixing fraction (Fe) and ﹩{\mathrm{log}}_{10}| {J}_{z,e}| ﹩, with the analyzed subregion highlighted by the magenta box.
Other Images in This Article
Copyright and Terms & Conditions
© 2026. The Author(s). Published by the American Astronomical Society.

